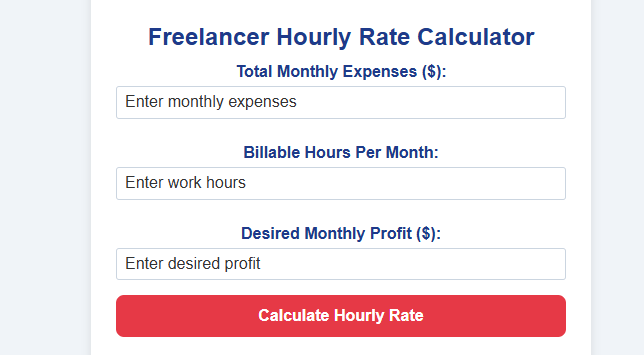
Advanced PAT Calculator
Calculate Profit After Tax with detailed financial analysis for Pakistani businesses
Profit Analysis
Enter your financial data to see detailed analysis
Profit Breakdown
Key Metrics
Profitability Analysis
Operating Margin Operating income divided by revenue
0%
Net Profit Margin
0%
Tax Efficiency
0%
Interest Coverage
0x
Tax Scenario Comparison
Current Tax Rate (29%)
PAT: PKR 0
SME Tax Rate (20%)
PAT: PKR 0
Manufacturing Tax Rate (15%)
PAT: PKR 0
Tax Holiday (0%)
PAT: PKR 0
Running a business in Pakistan is no small feat. Between managing daily operations, keeping customers happy, and navigating tax regulations, figuring out your actual profit can feel overwhelming. That’s where a Profit After Tax (PAT) Calculator comes in—a free, easy-to-use tool designed to take the guesswork out of your finances. At Sharks Tank Pakistan, we’ve created a PAT Calculator to help entrepreneurs, startups, and SMEs across the country understand their net profit with just a few clicks. Let’s dive into why this matters and how it can transform your financial planning.
Profit after tax represents the remaining earnings a business keeps once all taxes have been deducted from its total revenue. This indicator tells you the bottom line of a company's profitability.
It reflects the true profit left over after operating expenses are reinvested, shareholder distributions are paid, and profit is retained to grow the business in the future. Company financial statements usually focus on this number.
Profit after tax is a key performance indicator for investors and analysts, allowing them to determine the efficacy of company management. Whether analyzing quarterly reports or planning long-term strategies, understanding profit after tax provides valuable insights into profitability and efficiency.
In the paragraphs that follow, we will dissect its importance and calculation and how it plays a crucial role in shaping decisions made across business.
What is Profit After Tax?
Profit After Tax (PAT) is an important financial metric for determining the profitability left to shareholders after satisfying tax liabilities. It's one of the most closely watched financial metrics for determining a company's profitability and long-term financial sustainability.
By showing how much money remains after all expenses and taxes are deducted, PAT reflects a company's ability to generate returns for its shareholders, sustain operations, and grow over time.
1. Define Profit After Tax (PAT)
Similar to Earnings Per Share, PAT is a key indicator used to judge a company's profitability. It affects everything from competitive mergers and acquisitions to dividend distributions vs. Reinvesting cash into growth opportunities.
Let's say, just for example, a company that only makes $1 million in revenue. After expenses and a 30% tax rate, it would be left with $200,000 in profit after taxes (PAT). This remaining profit can either be returned to shareholders or invested back into the company.
Benefits of PAT
PAT is a key performance indicator for investors assessing a company's net profit margin and overall financial performance.
2. Understand PAT's Significance
Compared to gross profit and operating profit, PAT allows for a broader perspective on a company's overall profitability. Where gross profit is concerned with revenue less the cost of production, operating profit focuses on operational efficiency.
On the other hand, PAT includes an adjustment for taxes, giving a more refined view of bottom-line profitability. For instance, though EBITDA completely excludes taxes, PAT includes them, making it a better metric for long-term comparison.
3. Why PAT Matters to Stakeholders
Investors, creditors, and management all rely on the net profit margin to evaluate financial performance. Transparent and accurate reporting fosters trust, influences stock prices, and ensures accountability.
Calculate Profit After Tax
Profit after tax (PAT) is one of the most critical KPIs that reflects a business's overall financial performance, showcasing the net profit after all tax liabilities are settled. To arrive at PAT, various components are calculated stepwise, ensuring accuracy and adherence to transparent methodologies.
Start with Revenue
Revenue is the full amount of sales, with no expenses taken into account. Operating expenses are deducted to get profit before tax. Typical operating expenses range from rent, utilities, and salaries to marketing and administrative costs.
For example, a company with $500,000 in revenue and $200,000 in operating costs has a gross profit of $300,000. Effective management of these expenses, whether through strategic budgeting or proactive fiscal conservatism, has a direct impact on PAT. While COGS are directly related to manufacturing products, operating expenses are still required to operate the business smoothly.
Deduct Cost of Goods Sold (COGS)
COGS accounts for all the direct costs related to producing goods, including direct labor and raw materials. An accurate COGS is necessary to calculate a business's gross profit, known as the gross margin, and to find ways to improve margins.
For instance, by bringing down unnecessary inventory, businesses can cut down on warehousing expenses, thus improving the bottom line. Good inventory management protects the integrity of COGS by recording the actual production costs at the time of sale.
Determine Earnings Before Tax (EBT)
EBT is obtained by deducting all operating expenses and COGS (Cost Of Goods Sold) from the total revenue. For example, if gross profit totaled $300,000 and $50,000 in interest expenses are included, the EBT is $250,000.
This key measure examines operational efficiency before tax impacts and identifies areas for financial improvement.
Apply Relevant Tax Rate
First, calculate NOPAT by taking operating income and multiplying it by (1 – tax rate). Finally, EBT is multiplied by the 35% tax rate to calculate PAT.
In this case, $250,000 x (1 – 0.35) = $162,500, which means the company would be considered profitable after tax at that amount.
Arrive at Profit After Tax
Implementing cost control measures such as accurate forecasting, effective operations, and frequent financial oversight can lead to better net profit margins. Through careful planning and strategic execution, companies can increase their profitability ratio by reducing wasteful costs while still growing top-line revenue.
Factors Affecting Profit After Tax
Profit After Tax (PAT) is a crucial financial performance metric that signifies a company's efficiency in generating net income for shareholders while factoring in tax liabilities. By understanding tax profit margins and net operating profit, businesses can make informed decisions that promote long-term growth and enhance their overall profitability ratio.
Impact of Depreciation Methods
Depreciation directly affects profit after tax since it is the accounting method for assigning the cost of an asset over its useful life. Methods such as double declining balance allow asset owners to significantly reduce taxable income in the first years of an asset's life, reducing early-stage Profit After Tax (PAT).
The straight-line approach allocates the cost equally, resulting in stable PAT in the future. For instance, a business dedicated to making large capital investments would have an incentive to introduce an accelerated depreciation schedule to offset expected near-term tax liabilities.
These numbers may vary by driving or asset management strategies. The impacts of regular maintenance by directly increasing the remaining life of an asset extend its depreciation schedule and, therefore, reduce PAT.
Businesses that align their depreciation methods with their financial goals—whether that's balancing cash flow, meeting investor expectations, etc.—set themselves up for maximized long-term profit after tax.
Revenue Generation Strategies
Interest expenses from debt are tax-deductible, thus reducing taxable income and directly lowering PAT. Firms with high leverage have more debt than equity on their balance sheet.
As discussed above, when interest rates rise, high-interest obligations can significantly reduce their profit after tax (PAT). Curbing debt levels intentionally—through refinancing or not borrowing—supports not just financial health but also maximizing PAT.
Cost Management Techniques
Non-recurring events, like asset sales or impairments, can affect PAT. Accurate and transparent reporting of extraordinary items, such as costs involved with lawsuits or natural disasters, allows stakeholders to interpret financial performance appropriately.
For instance, requiring the documentation of asset impairments would make clear non-recurring losses that could otherwise confuse shareholders.
Tax Regulations and PAT
PAT is an important measure of a corporation's credibility. It clearly shows the net profit left over after all taxes are paid, which in turn reflects not just a business's profitability but also its effective tax management.
Both are critically important for maintaining momentum and establishing confidence with investors. Companies can improve bottom-line profitability by learning how tax regulations and PAT intersect. This knowledge enables them to make informed decisions without compromising compliance.
Corporate Tax Rate Variations
Additionally, industries are frequently subject to different corporate tax rates, leading to different PAT margins. Innovation, which is facilitated by tax incentives, allows technology sectors to operate at higher margins.
Compared to service, manufacturing typically operates on thinner margins due to its intensive costs. Below is a comparison of average PAT margins by industry:
| Industry | Average PAT Margin (%) |
|---|---|
| Technology | 20 |
| Healthcare | 15 |
| Manufacturing | 8 |
| Retail | 5 |
Factors that contribute to these disparities range from operational costs to tax credits to market demand. By benchmarking against industry standards, businesses can discover gaps and areas for improvement and better focus strategies that will lead to improved outcomes.
Impact of Tax Credits
Tax credits are the most straightforward way to affect PAT since they operate by directly reducing tax liabilities. Measuring PAT against competitors gives a good indication of how PAT is positioned in the market.
For instance, a company taking full advantage of R&D tax credits will have a lower PAT, suggesting a competitive edge. Transparency in competitor financials ensures accurate analysis, guiding internal improvements.
Effects of Tax Planning Strategies
Smart tax planning serves both purposes by ensuring higher revenue. Examples of these strategies are product innovation, targeted marketing, and customer loyalty programs.
Breaking into new, previously unreached markets increases the bottom line even more by diversifying income sources.
Industry Benchmarks for PAT
PAT is often considered the most important measure of a company's long-term sustainable earning potential, reflecting a company's overall financial performance and operational efficiency. By understanding industry benchmarks and implementing tailored strategies, companies can optimize their net profit margins and improve their tax profitability to stay ahead of the competition.
PAT Margins Across Industries
Industry benchmarks for PAT margins are blanket statements that often mislead. Industries like technology, pharmaceuticals, and consumer products aim for profit margins of over 20%. In aerospace and defense's case, they only average around 4.05%.
Margins greater than 10% are usually seen as robust, indicating resilience and attracting investor interest. Strategic tax planning makes these benchmarks possible. The business community understands that they can use tax incentives and credits—think research and development (R&D) tax breaks—to lower overall liabilities.
Smart tax strategies include timing income and deductions, using carryovers, and investing in tax-advantaged assets. Engaging tax professionals helps structure transactions appropriately, maintain compliance, and achieve the best outcomes.
Compare PAT with Competitors
A 70% debt-to-equity ratio is considered a healthy level of risk. Companies can reduce interest expenses through refinancing measures, such as renegotiating lower rates or consolidating loans.
Strong debt management, along with strong practices for cash flow forecasting and management, prepares local governments to meet obligations without stretching cash resources. For instance, regular tracking of cash coming in and going out allows leaders to focus on the most important payments and not borrow when it isn't needed.
Analyze Industry-Specific Factors
Accurate expense tracking is crucial for accurate PAT calculations. Confusion over inconsistent reporting can mislead stakeholders and erode trust among partners, and a lack of documentation can result in missing deductions.
Technology, such as accounting software, makes tracking expenses easier, reducing the likelihood of human error while improving overall transparency. Strong financial practices result in better-informed decisions that position communities for long-term success.
Improve Your Profit After Tax
PAT is arguably the most important indicator of a company's financial condition, reflecting the net profit after satisfying all tax-related duties. Addressing factors that they can control, along with external influences that affect tax profit margins, will shape more strategic decision-making and improve sustained financial performance.
Increase Sales and Revenue
Ignoring depreciation can skew PAT calculations by exaggerating profits because it fails to account for asset deterioration. Performing regular asset valuation checks will help you be confident that your financial statements portray the true value of your assets, adding greater accuracy.
For example, if equipment depreciates $50,000 per year, ignoring that depreciation presents a false picture to the stakeholders. Correctly accounting for depreciation will help you present an accurate picture of your profitability and determine how profitable your business truly is.
Long-range capital planning pays dividends. Long-term knowledge of depreciation trends can better inform reinvestment strategies and identify the timing of best asset purchases.
Reduce Operational Costs
Excluding one-time items, such as legal settlements or unexpected repairs, from PAT calculations can create an inaccurate picture of profitability. Better transparency in financial reporting improves trust with stakeholders and gives a better picture of what's happening on an ongoing performance basis.

Forinstance, if a one-time expense of $10k is left out, it could wildly overstate profits. Comprehensive analysis of operational costs, including recurring and non-recurring expenses, ensures a more accurate view of financial health and supports effective cost management.
Optimize Tax Strategies
PAT is an important valuation metric for companies. It helps investors understand what return they can expect and how one stacks up against peers. Adding PAT into discounted cash flow models keeps projections grounded in reality.
PAT is acutely affected by a 30% tax rate, highlighting the importance of smart tax planning.
Common Pitfalls in PAT Calculation
Profit after tax (PAT) has long been one of the most important indicators of a company's financial performance ratio. Erroneous assumptions in its calculation can lead to misguided conclusions about true profitability, which can have serious ramifications for strategic decision-making. The better we understand these pitfalls, the clearer our insights into what drives our net profit margins will be.
Historical PAT Data and Future Projections
Historic PAT data is used as a starting point to project the future. Trends, either positive or negative, or outlier performances inform the setting of expectations and guide the identification of an appropriate performance baseline.
For instance, if a company's PAT grew by 10% annually over five years, future projections might factor in similar growth, assuming stable conditions. Failure to look back at previous data might lead you to forecast inaccurate profitability—either too high or too low.
Market Conditions in Forecasts
External market conditions, including competition or economic changes, largely affect PAT. For example, reduced consumer spending during a recession would decrease revenues, impacting any PAT projections.
Firms that do not prioritize reconciling such factors are likely to produce projections that are increasingly misaligned with real-world results. For instance, many retail enterprises experience a seasonal uptick, so retail risk predictions would need to account for this anticipated holiday influx.
PAT Trends and Investment Decisions
Analyzing PAT trends can help prioritize capital for safety or maintenance. Long-term growth in PAT makes the case for reinvesting earnings into growth.
Negative trends could indicate a greater urgency to rein in costs. This enables companies to focus on the highest-returning projects first.
Scenario Analysis for Profitability
RescuePlan's scenario analysis helps businesses prepare for uncertainty by evaluating various outcomes. Adopting such forecasting—for instance, predicting how increasing material costs will likely impact PAT—enables proactive rather than reactive, price changes.
This strategy leads to healthier financial sustainability amid fiscal chaos.
PAT in Investment Analysis
Profit After Tax (PAT) is an important measure of a company's overall profitability. It's the amount left after accounting for all expenses, taxes, and other costs. PAT is a cornerstone metric in financial analysis, offering investors and analysts a clear view of a business's financial health.
Beyond the numbers, PAT provides meaningful insights into a company's capacity to sustain growth, reward shareholders, and navigate market challenges.
Use PAT for Valuation
PAT is a key component in most valuation models, such as Price-to-Earnings (P/E) ratios, where it is the "earnings" portion. A higher PAT generally means a company is more profitable, which lends itself to a higher valuation. Take a company that makes $1 million in PAT but exhibits a clear and consistent growth pattern.
Unfortunately, increased interest invariably results in a significant short-term increase in the stock's share price. Analysts rely heavily on this metric to determine whether a stock is under or overvalued, making PAT a powerful tool in equity analysis.
Not to mention one-time events such as asset sales and restructuring charges. These factors can unduly pump up or skew PAT, leading to potentially misguided valuation analysis.
Assess Company Performance
PAT margins greater than 10% are generally seen as an indicator of fiscal health. A quickly increasing PAT trend is a strong sign that a company is fundamentally sound. It underscores their prowess in cost control, pricing defense, and operational leverage generation.
To illustrate, a company that has steadily increased its PAT over the past five years shows strength and effectiveness. Conversely, falling PAT margins could be a warning sign of rising cost pressures or competitive headwinds.
PAT is an immensely valuable asset to us, providing great insights. However, it ignores cash flows and operational efficiencies, so it's just one of multiple tools for a complete performance appraisal.
Predict Future Profitability
PAT trends provide insights into a company's prospective earning capacity. Steady PAT growth indicates an effective, if not flawless, tapped strategy and willingness to scale and grow.
For instance, a tech firm with a PAT margin of 12% can reinvest profits into innovation while rewarding shareholders. On the other hand, if PAT is standing still or declining, it heralds warning signs, prompting a more profound investigation into the company's financial path.
External Economic Factors

External economic factors have a huge impact on a company's net profit margin. These influences frequently reach outside the organization's four walls, reflecting external market realities and government policies. Understanding these external economic factors is critical to assessing financial performance and long-term sustainability.
Impact of Inflation
Inflation has profoundly impacted both consumers' purchasing power and businesses' operational costs. When inflation increases input costs—e.g., for raw materials, labor, and utilities—PAT margins can be threatened.
Only companies with solid pricing power can pass these costs to end consumers, keeping their margins healthy. Otherwise, a business with a PAT margin greater than 10% is considered financially robust.
Second, despite cost and inflationary pressures, revenue is being successfully transformed into increasing profits. Inflation affects foreign exchange rates, which can be hugely disruptive for companies that operate internationally, changing tax obligations overseas.
Effects of Interest Rates
Higher interest rates increase the cost of borrowing and make previously viable investments unprofitable. Additionally, rising rates raise the cost of debt, which could further reduce PAT as firms have to devote more revenue to servicing existing debt.
Conversely, low-interest environments make it cheaper to borrow and expand, thus producing more revenue streams in the future. For instance, government borrowing can crowd out private investment, lowering the potential income from investments in future years.
Pro-growth policies that support innovation and productive investment could help offset such impacts.
Influence of Economic Growth
Healthy economic growth fuels consumer spending and business investments, which has a direct positive effect on revenue and PAT. Subsidies or other government incentives, while the industry is growing, can further boost profitability through reduced operating costs.
On the flip side, slow growth or recessions can decrease demand, shrinking PAT to a much smaller level. A solid PAT gives the investor a guarantee of hard cash profit, supporting dividends to shareholders, which is key to investor confidence.
Conclusion
Profit after tax is the most important measure for showing the financial health of your business. It is a measure of how much income you get to keep after paying not just federal but state and local taxes and other obligations. A robust PAT equals smarter, more efficient growth, increased investor interest, and a stronger competitive advantage in your market. Tax policy, capital markets, and cost containment are all external pressures and influences, and staying ahead of these tides is how you maintain that equilibrium. Keeping an eye on industry benchmarks can further help you identify how you compare and what needs to be improved.

Paying attention to PAT isn't only good for your business; it can inform better short—and long-term decision-making. If you want to continue to be ahead of the curve, get more efficient and nimble with change. The work returns dividends ina larger bottom line and increased resilience. Continue to make your case and see your positive impact expand!
Frequently Asked Questions
What is Profit After Tax (PAT)?
Profit After Tax (PAT) represents the net income that a company generates after paying all mandatory taxes, reflecting its tax profit margin. This financial metric is crucial in determining the company's overall profitability and financial performance.
How is Profit After Tax calculated?
PAT, or net profit after tax, is derived by deducting total tax liability from the entity's profit before taxes, reflecting true profitability. The formula is: PAT = Pre-Tax Profit - Taxes.
Why is Profit After Tax important?
PAT accurately measures a company's true profitability after accounting for tax liabilities, including corporate income tax. This financial performance ratio helps stakeholders understand the entity's efficiency and financial condition, leading to improved decision-making.
What factors influence Profit After Tax?
These factors are important to consider, including tax rates, daily operational costs, distance revenue, and external economic climate. As you can see, efficient tax planning can significantly enhance net profit margins and overall financial performance.
How does Profit After Tax affect investment decisions?
Investors consider PAT margin to determine a company's ability to generate net profit. A positive and growing PAT is a sign of good financial performance, making the company much more attractive to invest in.
How can businesses improve their Profit After Tax?
Companies can drive net profit margin in four ways: cutting expenses, enhancing tax strategy, boosting revenue, and increasing business efficiency.
What are common mistakes in calculating Profit After Tax?
Typical mistakes include applying the wrong tax rate, missing deductions, or misclassifying expenses, which can negatively impact your net profit margin. Staying on track with accurate financial records and professional advice significantly enhances your financial performance.